
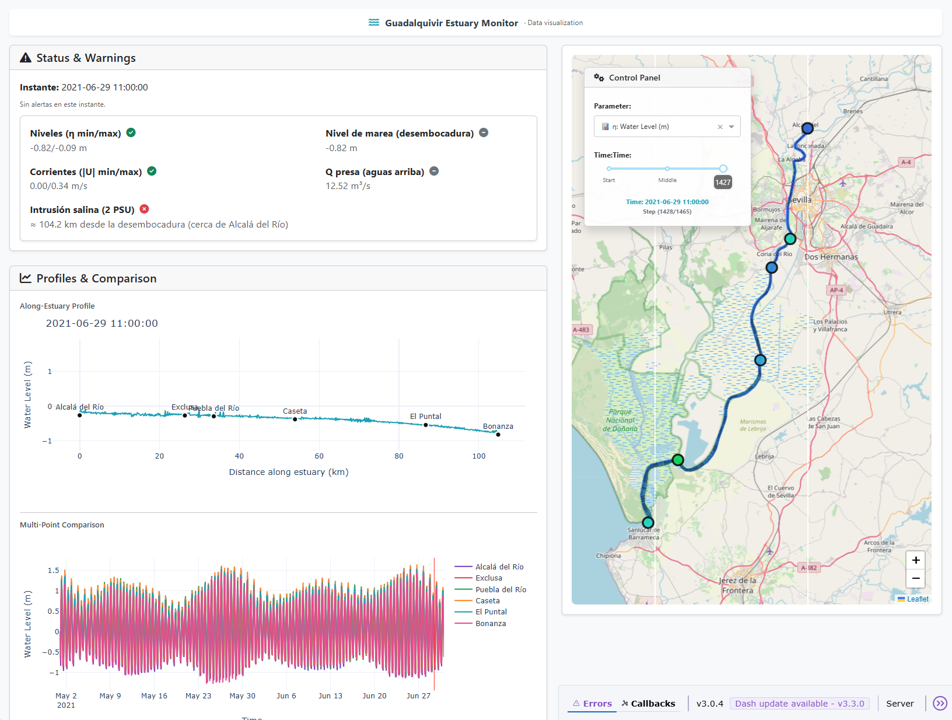
As part of the BARRIER project’s digital ecosystem, we have developed an interactive web-based data viewer designed to explore, compare, and communicate the key datasets underpinning the hydrodynamic and biogeochemical analysis of the Guadalquivir estuary. The tool provides a lightweight and accessible interface that brings together the most relevant observational and model-derived information currently available in the project.
The viewer integrates the updated and curated datasets that correspond to the present stage of development, including:
- Bathymetry and topography from field campaigns
- Hydrodynamic and salinity observations from field campaigns
- River discharge and water-level data from national monitoring networks
- Meteo-oceanographic reanalyses and projections from CMIP5 and Copernicus (E‑HYPEcatch)
All sources have been harmonized, validated, and updated to ensure consistency across spatial and temporal scales. This process includes gap‑filling using advanced data‑driven techniques, currently being formalized in Navarro et al. (2026, in preparation).
The platform allows users to visualize time series, spatial fields, salinity patterns, water levels, flows, and sediment‑related diagnostics, with synchronized temporal navigation and the ability to compare scenarios or datasets side by side. Additional tools enable point inspection, layer control, and the export of visual outputs for technical reporting.
The viewer is conceived as a modular and extensible component of the project. Its architecture supports the progressive incorporation of new datasets and diagnostics as the project advances, ensuring transparency, reproducibility, and reusability for other research groups and stakeholders.
Ultimately, this tool strengthens the project’s commitment to open science and knowledge transfer, offering researchers, managers, and the public a clear and intuitive way to explore the dynamics of the Guadalquivir estuary.